Ambientの位置情報付きデーターをPythonで読み込み、GeoDataFrameに変換し、地図上にマップしてみます。
位置情報を扱うにはgeopandasとgeopyが、地図にはfoliumというライブラリーが必要なので、それらをインストールしておきます。
$ pip install geopandas geopy
$ pip install folium
以下はJupypter Notebookでの実行です。まず、必要なライブラリーをimportします。
In [1]:
import ambient
In [2]:
%matplotlib inline
import numpy as np
import pandas as pd
import geopandas as gpd
from shapely.geometry import Point
Ambientからデーターを読み込み、DataFrameに変換し、データー生成時刻をTimestampに変換し、indexに設定します。ここまではAmbientのデーターをPython pandasで扱うための準備です。
In [3]:
am = ambient.Ambient(チャネルID, "", "リードキー")
d = am.read(n=300)
df = pd.DataFrame(d)
df['created'] = pd.to_datetime(list(df['created'])).tz_localize('GMT').tz_convert('Asia/Tokyo').tz_localize(None)
df = df.set_index('created')
データーを確認します。各データーの位置情報は’loc’に経度、緯度のリストで入っています。
In [4]:
df.head(3)
Out[4]:
位置情報をgeometryに変換します。
In [5]:
geometry = [Point(xy) for xy in df['loc']]
geometry
Out[5]:
DataFrameとgeometryからGeoDataFrameを作ります。crsはCoordinate Reference Systemsの略で、座標軸を地球上の場所に対応付けるもののようです。
In [6]:
gdf = gpd.GeoDataFrame(df, geometry=geometry, crs={'init' :'epsg:4326'})
gdf
Out[6]:
total_boundsでGeoDataFrameに含まれる全ての地点を囲む四角形の南西(地図上の左下)と北東(右上)の経度、緯度のtupleが得られます。
In [7]:
gdf.total_bounds
Out[7]:
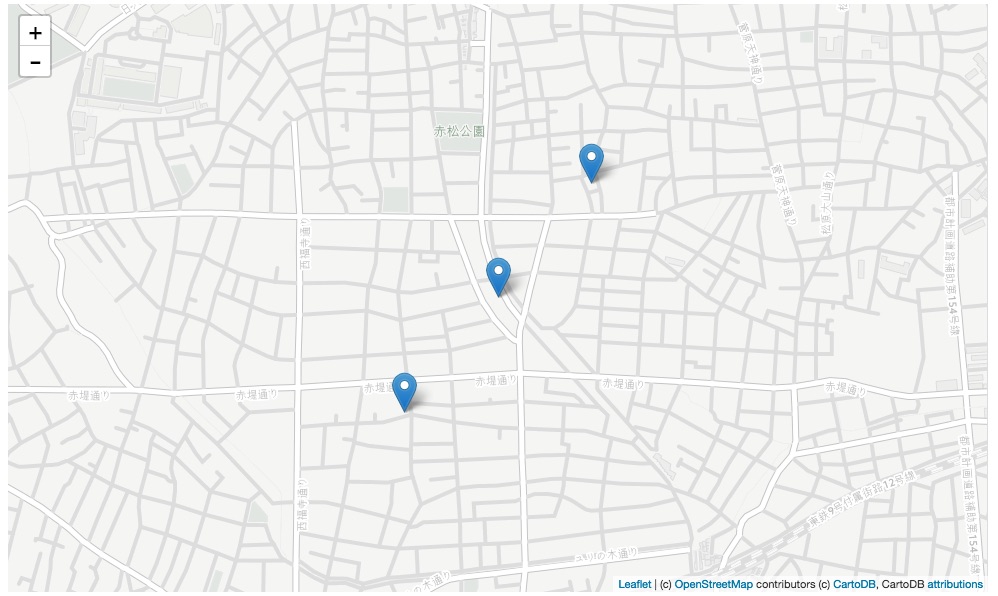
foliumをimportし、地図を描画し、GetDataFrameのデーターを地図上にマップします。FitBoundsというメソッドで地図で表示する領域を指定できます。ただし、引数を[[南西の緯度, 南西の経度], [北東の緯度, 北東の経度]]の順に指定する必要があります。total_boundsで得られるのと緯度、経度の順番が逆なので、1つずつ指定しなくてはなりません。もっとエレガントな方法があるような気がします。
In [8]:
import folium
In [9]:
m = folium.Map(tiles='cartodbpositron')
folium.FitBounds([[gdf.total_bounds[1],gdf.total_bounds[0]],[gdf.total_bounds[3],gdf.total_bounds[2]]]).add_to(m)
folium.GeoJson(gdf).add_to(m)
m
Out[9]: